11Jan

Tesla Inc.(TSLA:NASDAQ) Elliott Wave Technical Analysis 11 January 24

Tesla Inc., Elliott Wave Technical Analysis

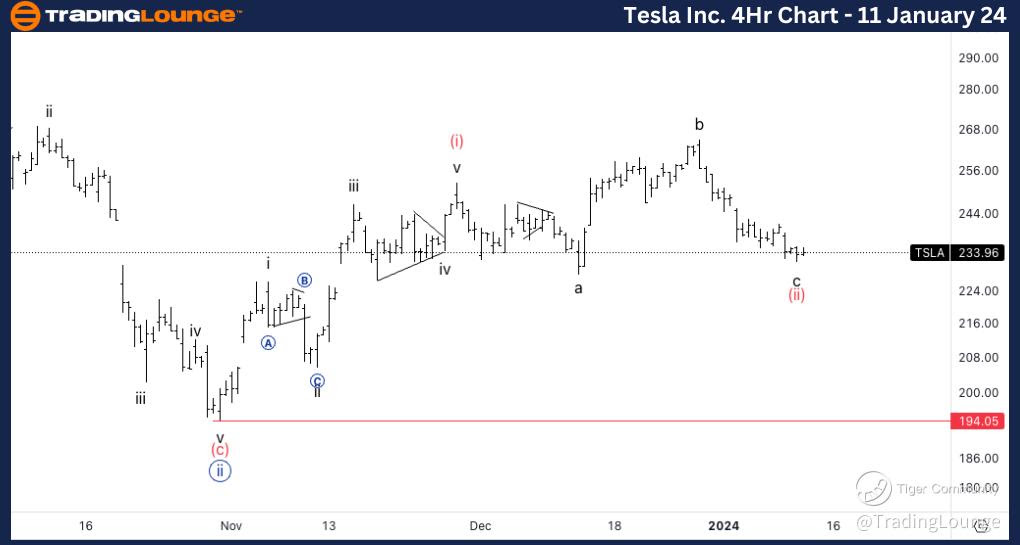
Tesla Inc., (TSLA:NASDAQ): 4h Chart 11 January 24

TSLA Stock Market Analysis: We have been looking this down move into wave c for a while now as we continue to prefer an overall bullish count for the time being. In order to actively look for longs we need the top of wave b to be broken.  

TSLA Elliott Wave Count: Wave c of (ii).

TSLA Technical Indicators: Below all averages, volume starting to increase.  

TSLA Trading Strategy: Looking for longs after a break of b.  

TradingLounge Analyst: Alessio Barretta

Source : Tradinglounge.com get trial here!


Tesla-4Hr-Stock-Char...


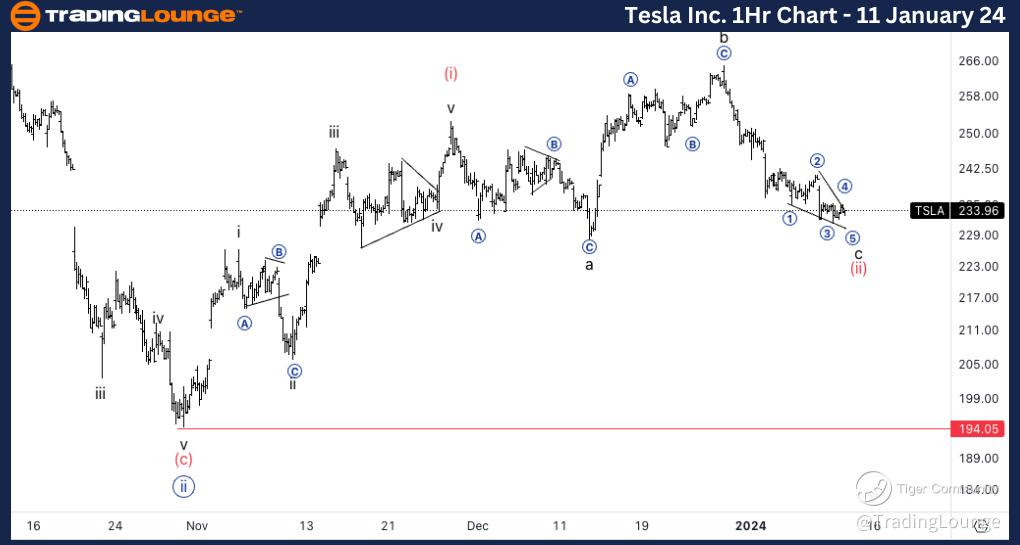
Tesla Inc.,  TSLA: 1-hour Chart 11 January 24

Tesla Inc.,  Elliott Wave Technical Analysis TSLA Stock Market Analysis: We are starting to see a series of overlapping wave within wave c which could make us think about and ending diagonal, as well as we are seeing RSI bullish divergence.  

TSLA Elliott Wave count:  Wave c of (ii).

TSLA Technical Indicators: Below all averages.

TSLA Trading Strategy: Looking for longs after a break of b.


Tesla-1Hr-Stock-Char...

Related

U.S.Dollar/Canadian Dollar(USD/CAD) Elliott Wave Technical Analysis 12 December 23

U.S.Dollar/Canadian Dollar(USD/CAD) Elliott Wave Technical Analysis 12 December 23

USD/CAD Elliott Wave Analysis Trading Lounge Day Chart for 12 December 23, provides an in-depth exam...

Read More >
Theta Token / U.S. dollar(THETAUSD) Elliott Wave Technical Analysis 14 November 23

Theta Token / U.S. dollar(THETAUSD) Elliott Wave Technical Analysis 14 November 23

Theta Token / U.S. dollar(THETAUSD) Elliott Wave Technical Analysis 14 November 23,

Read More >
"Elliott Wave Analysis of Key Indices: S&P 500, NASDAQ 100, Russell 2000, DJI, DAX 40, FTSE 100, ASX 200, and Nikkei"

"Elliott Wave Analysis of Key Indices: S&P 500, NASDAQ 100, Russell 2000, DJI, DAX 40, FTSE 100, ASX 200, and Nikkei"

"Delve into our detailed Elliott Wave Analysis of the Stock Market, focusing on key indices i...

Read More >
KOSPI Composite Index Elliott Wave Technical Analysis shows Bullish Trend Currently on both Daily and Weekly Charts

KOSPI Composite Index Elliott Wave Technical Analysis shows Bullish Trend Currently on both Daily and Weekly Charts

The KOSPI Composite is currently in a bullish trend, supported by Elliott Wave analysis on both dail...

Read More >
Ethereum ETH (ETH-USD) Price Chart Analysis daily | ETHUSD Elliott Wave Technical Analysis daily

Ethereum ETH (ETH-USD) Price Chart Analysis daily | ETHUSD Elliott Wave Technical Analysis daily

Elliott Wave Analysis TradingLounge Daily Chart, 11 October 23 Ethereum/U.S. dollar(ETHUSD) ETHUSD...

Read More >

Buy 1 Month

Get 3 Months!

Special Offer:

Trade Recommendations

Unleash the power of deversified trading with our comprehensive portfolio, covering:

  • Stock Trades
  • Crypto Trades
  • Forex Trades
  • Commodity Trades
Elliott Wave Analysis

Gain a competive edge with expert insights in to:

  • Global Indices
  • US Stocks & ASX Stocks
  • Forex & Crypto
  • Commodities
Top-Notch Trading Tools

Equip yourself with the tools of success:

  • Social Chat
  • Elliott Wave Algorithm
  • Screener
  • TradingLevels
  • Trading Game
7 Elliott Wave Analysts

Stay ahead of the market with daily charts and insightful videos
-Your secret to strategic trading!

JOIN HERE


Welcome to TradingLounge (ASIC A.R.No. 321187), specialists in trades, trading education and technical analysis, covering stocks, indices, commodities, forex and cryptocurrencies.

When you join TradingLounge you have access to everything we offer, including trade tools, educational content and a social platform to chat with like-minded investors.

Read more

@Copyright 2024 by tradinglounge.com

Contact Us

Australian no: 02 4787 6020

International no: +61 (2) 47876020

Pay with:

Find us on